Plot an r3d Object
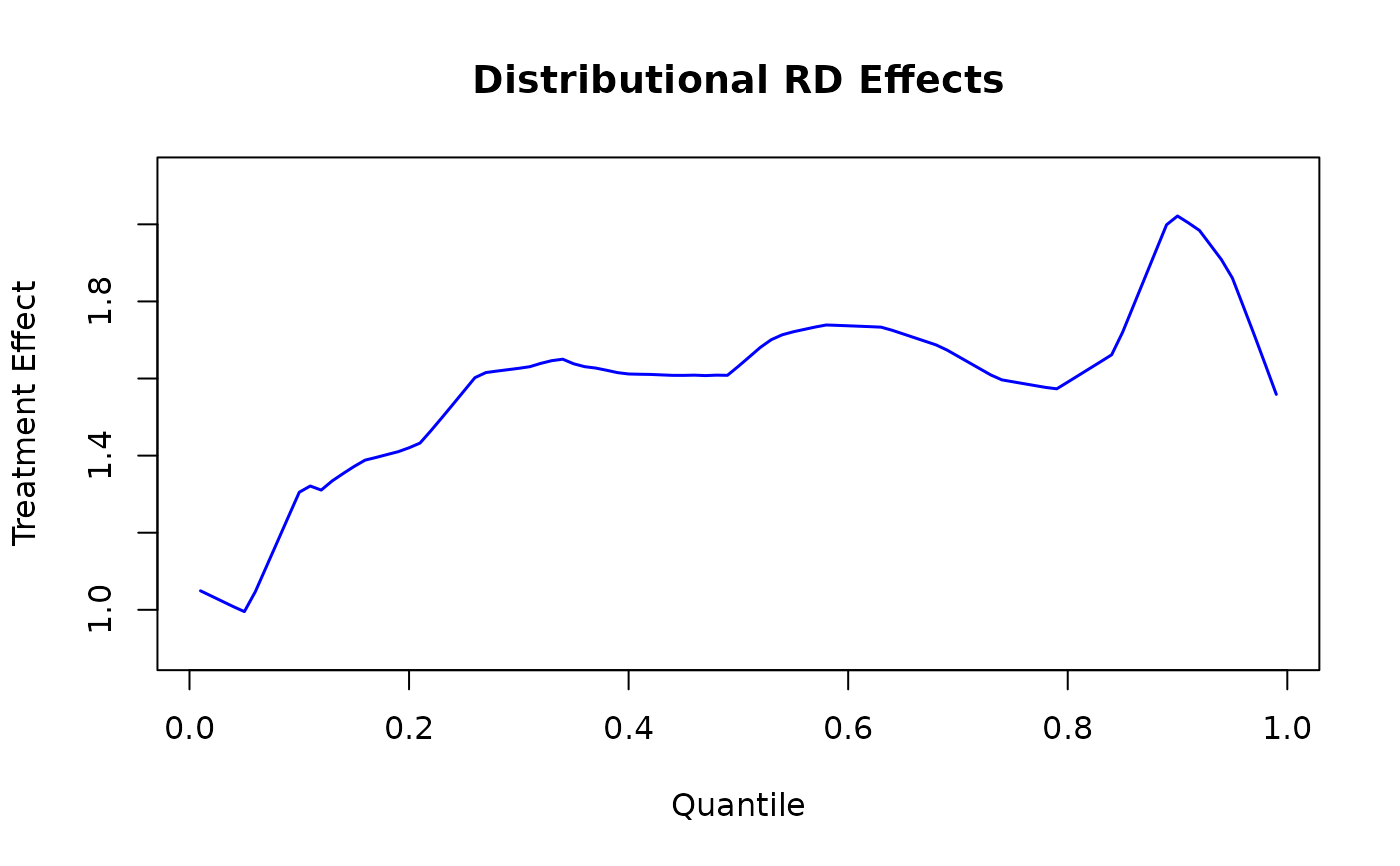
plot.r3d.RdProduces a simple plot of the estimated distributional RD effect \(\tau(q)\) as a function
of the quantile \(q\), optionally with uniform confidence bands if they are available in
the fitted r3d object.
# S3 method for class 'r3d'
plot(
  x,
  main = NULL,
  ylim = NULL,
  xlab = "Quantile",
  ylab = "Treatment Effect",
  col = "blue",
  lwd = 1.5,
  ci_col = "gray",
  ci_lty = 2,
  ref_line = TRUE,
  ...
)
Arguments
- x
An
r3dobject fromr3d.- main
An overall title for the plot. If
NULL, a default title is constructed.- ylim
Y-axis limits. If
NULL, the limits are set automatically.- xlab
Label of the x-axis, defaults to
"Quantile".- ylab
Label of the y-axis, defaults to
"Treatment Effect".- col
Color for the main line. Defaults to
"blue".- lwd
Line width for the main curve. Defaults to 1.5.
- ci_col
Color for the confidence-band boundaries. Defaults to
"gray".- ci_lty
Line type for the confidence-band boundaries. Defaults to 2 (dashed).
- ref_line
Logical indicating whether to draw a horizontal reference line at 0. Default
TRUE.- ...
Additional plotting parameters passed to
plot.
Value
Returns the x object invisibly.
Details
If bootstrap inference was performed (boot=TRUE in r3d), the object
contains cb_lower and cb_upper for uniform confidence bands.
These bands are added to the plot if available.